No chance of getting them on the real dashboard
Thursday, November 21, 2013

Changing scale from time to distance
Most charts have time on the X axis.
Here's how to change to distance.
Note: you must have "Trip Distance" PID in the log for this to work.
Example: changing from time to distance in the Speed / Altitude chart.
Go to the Speed / Altitude chart

Click anywhere into the chart to cause the edit arrow to appear:
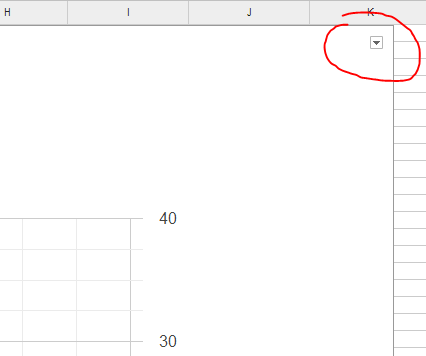
Click on the arrow and then select "Advanced edit..."

In the chart editor window select "Start"

Then click on the "Get data range" grid

Select the first data row

Click on the "Data" sheet

Click on the column header of the "Trip Distance" PID: the whole column will change color and the data box will change with the column letter.

Click Ok and then Update on the chart editor window.
Chart will be updated with km on the X axis.

Here's how to change to distance.
Note: you must have "Trip Distance" PID in the log for this to work.
Example: changing from time to distance in the Speed / Altitude chart.
Go to the Speed / Altitude chart
Click anywhere into the chart to cause the edit arrow to appear:
Click on the arrow and then select "Advanced edit..."
In the chart editor window select "Start"
Then click on the "Get data range" grid
Select the first data row
Click on the "Data" sheet
Click on the column header of the "Trip Distance" PID: the whole column will change color and the data box will change with the column letter.
Click Ok and then Update on the chart editor window.
Chart will be updated with km on the X axis.
Extending charts
Builtin charts can be extended easily.
Example: adding Coolant Temperature to Speed / Altitude chart.
Go to the Speed / Altitude chart
Click anywhere into the chart to cause the edit arrow to appear:
Click on the arrow and then select "Advanced edit..."
In the chart editor window select "Start"
Then click on the "Get data range" grid
Select "Add another range"

Another box will appear

Click on the "Data" sheet

Click on the column header you want to add: the whole column will change color and the data box will fill up with the column letter.

Click Ok and then Update on the chart editor window.
Chart will be updated with the selected column

Example: adding Coolant Temperature to Speed / Altitude chart.
Go to the Speed / Altitude chart
Click anywhere into the chart to cause the edit arrow to appear:
Click on the arrow and then select "Advanced edit..."
In the chart editor window select "Start"
Then click on the "Get data range" grid
Select "Add another range"
Another box will appear
Click on the "Data" sheet
Click on the column header you want to add: the whole column will change color and the data box will fill up with the column letter.
Click Ok and then Update on the chart editor window.
Chart will be updated with the selected column
Wednesday, November 20, 2013
V23 released
News:

- better handling of resume on "Execution time exceeded" error
- sweet stop analysis (low RPMs with high mileage)
- two new PIDs required for sweet spot: "Timing Advance", "Engine Coolant temperature".

Tuesday, November 19, 2013

Thursday, November 14, 2013
ECO
While investigating on ECO mode, I was curious to check if that mode affects fuel consumption.
I've driven the same track in Normal and in ECO mode:

 I've found no differences.
Let's see Accelerator Pedal:

 Wider range in ECO.
I've driven the same track in Normal and in ECO mode:
Let's see Accelerator Pedal:
Subscribe to:
Posts (Atom)