Monday, March 21, 2016

ICE Efficiency

Thanks to slowmark from Hybrid Synergy Forum, I introduced the ICE Efficiency measurement: it's an indication of how much efficiently you are burning your fuel.
Basically it's power divided by consumption (Actual Engine Torque * RPM / FuelFlow), scaled from 0 to 100.


There are 2 Efficiency charts:

  • Percent Efficiency measure efficiency relative to the maximum observed value in the whole trip. It's charted alongside RPMs and SOC for easy analysis.
    It can't be directly compared between different trips or cars
  • Absolute Efficiency reports efficiency value unscaled.
    This may be used to compare different trips from the same car.

Comparing efficiency between different cars may be done with caution:
  • on Toyota HSD cars, "Actual Engine Torque (Nm)" is a custom PID collected by ECU, and thus may be considered an accurate value, as much as RPM and FuelFlow.
  • on generic cars, "Actual engine % torque(%)", a generic Torque PID is used. This value is a percentual value, and it can't be directly compared with values collected from HSD PIDs

So comparing absolute Efficiency values from two different HSD cars makes sense, while comparing to non-hybrid cars does not.

Note as lower RPM may lead to higher efficiency.


Sunday, December 27, 2015

Support for OBD Fusion added

Unfortunately, the Torque Pro app is not available for iOS, so one of the recurring questions is: how do I log data with my iPhone?
Thanks to Hybrid-Brain of Hybrid Synergy Forum, now Torque Log Analyzer supports log files from the OBD Fusion app, that also runs on iOS.
Just import you CSVLog file as usual and run Torque Log Analyzer.
You'll still need to import the custom PIDs as usual, to fully access all the available charts.


Saturday, December 19, 2015

Info/Suggestions on Torque Log Analyzer

If you need info or have any suggestions on Torque Log Analyzer, you can find an email address to contact in the About menu.


Saturday, December 12, 2015

Inverter Temperature

Torque Log Analyzer now draws Inverter Coolant Temperature on the Temperature chart. Note that one more PID is needed: check the FAQ page for the complete list of required PIDS.


Saturday, November 28, 2015

Map your car fuel consumption

Torque Log Analyzer can be used on non-Hybrid cars also.
Here's a sample, using the RPM & Fuel Distribution chart, to map fuel consumption.
You'll need to collect RPM, FuelFlow (cc/min), and OBD Speed PIDs, which are standard PIDs, available for every car model.

As fuel consumption, at a given speed, is affected by many factor, (temperature, acceleration, slope), one single trip won't give consistent results, so collect multiple trips.
Best trips are:
1) trips on the same road, in both directions (to even out elevation differences), with similar weather conditions.
2) trips with long stretches of constant speed
3) different speeds on the same trip
4) same PIDs on all the trips, in the same order.
5) record mileage reported by the on-board computer for each trip, in L/100km.

Open the first csv log file
Select File / Import and choose the second log file
Select "Append rows to current sheet" as the import action
Repeat for all the log files.

Start Torque Log Analyzer
Select Additional Analytics / RPM & Fuel distribution
Select Option / Car: non-Hybrid
Select Option / Flow Correction Factor and set it to the value explained at this link

Click Analyze

Here is the result for a Fiat Panda 4x4 1.3Mj 75cv:


Friday, November 27, 2015

Flow Correction Factor

You may have noticed that the mileage reported by Torque is different from the consumption measured at the fuel station with the full-to-full method.
The Flow correction factor is applied to the Fuel Flow reported by Torque, to get results consistent with the one measured at the fuel station.

You can compute the flow correction factor following these steps:
1) Fill up fuel tank
2) Reset trip mileage and odometer.
3) Drive until a new fill up is required
4) At the new fill up write down trip distance and mileage (let's call them tdist and tmil) and the litres needed to fill up the tank. (l)

Note: mileage here is intended measured in litres/100Km

Calculate the effective mileage:
emil = (l / tdist) * 100

and then the offset from reported:

off = emil / tmil

For example, for a Fiat Panda 1.3Mj 75cv 4x4 Diesel car, I run 511 km with 27.58 litres, while the trip mileage indicator was 5.0l/100km

The effective mileage is (27.58 / 511) * 100 = 5.39 l/100km
While the offset is 5.39 / 5.0 = 1.078

So, every time the car is reporting a given mileage, the effective consumption is really 1.078 times the indicated value.

To calculate the Flow Correction Factor, you'll need a trip log on which you also recorded the mileage as indicated by the on-board computer of the car.
Now, load up a trip in Torque Log Analyzer and run an analysis with the Force Mileage option set to the mileage reported by the car from that trip (4.8 L/100km in this example)


After the Analyze run is completed, switch to the Calc sheet and get the CDB Correction value:


Repeating the procedure with several different trips and averaging the results, will give more precision.
For the example car (Panda) this resulted in 0.82120

Saturday, October 10, 2015

S1b charging values

It's a common rule of thumb that, while perfoming the first cold ignition of the Yaris Hybrid, you can push up to the 2nd mark of the ECO level without draining the battery.


This seems not to be always the case.
I've observed that at a low SOC level (battery indicator at 4 bars), you can push as much as the half of the ECO zone, and still charge the battery.

Look at this chart, where S1 starts with SOC > 50%.
As soon as the Hybrid System Indicator raises over the second mark, Battery Current goes positive, thus draining power from the battery to push the car.
This is the commonly observed behavior.


Now, look at this chart, where S1 starts with SOC < 50% (4 bars on the dashboard).
Even going with the power meter at half of the ECO scale, current remains negative (flowing from the motor/generator to the battery pack).


So, where is this additional current coming from?
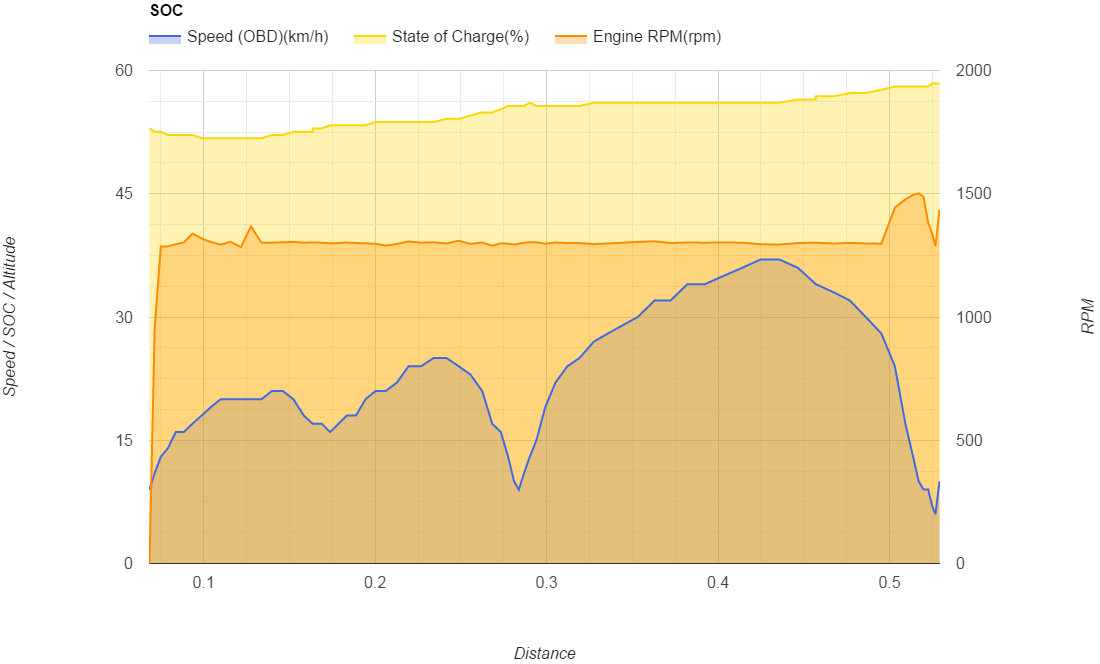
Engine RPM are the same in both cases:


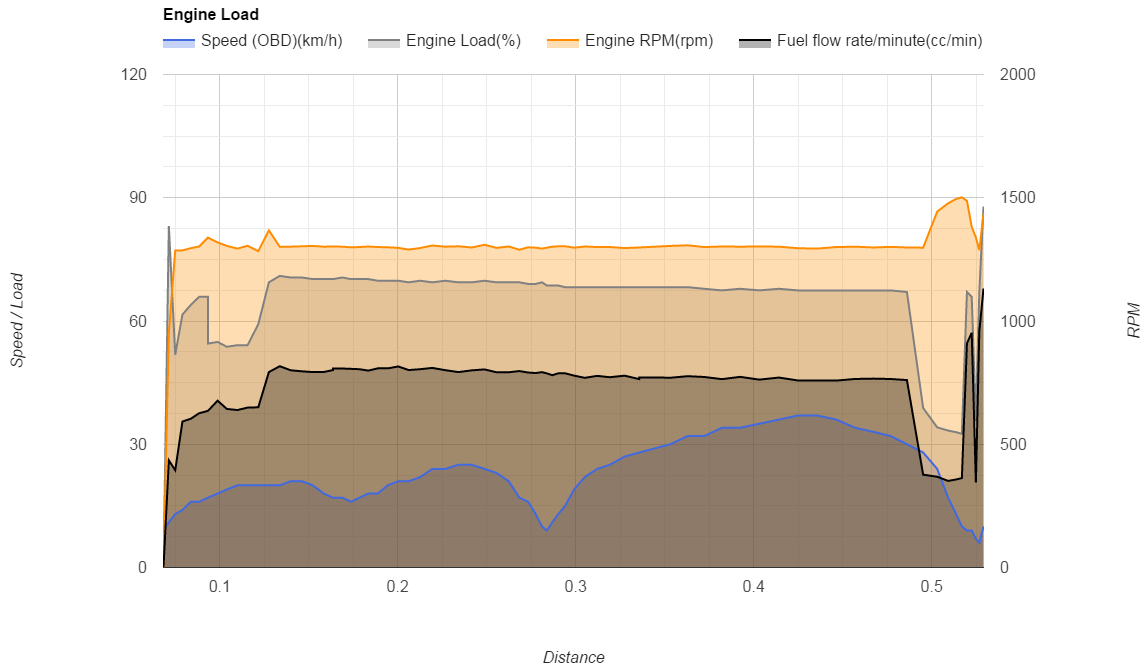
Let's check Load and Fuel Flow:


Same values in both scenarios also.
This scenario has been investigated on a Hybrid Synergy Forum thread.