Sunday, March 29, 2015

Fuel Flow at Highway Speeds

Here's a chart with fuel flow by speed.
It comes from a 4 hours highway trip.
Trip was back and forth, to compensate for road altitude and SOC differences, as SOC average value was 60.49%.
The chart starts at 80 km/h where EV is not available, so this is indeed only ICE consumption.
Interesting curves here are the bold blue one, representing average RPM at each given speed, and the yellow one, average fuel flow at the same speed.
We can note that until a little more than 90 km/h, the fuel curve follows RPM curve by staying under it. After that, fuel flow begin to grow with a steeper angle.
I suspect aerodynamic drag may be the primary suspect here.


Chart with added load and enhanced grid:

Chart from a user willing to drive way faster than me:


Relationship between Fuel and Speed


Sunday, March 22, 2015

RPM Distribution

This chart shows minimum, maximum and average RPM for each speed value in a trip.
This actually makes sense in cars without a CVT-style gearbox, as the manual pictured below.
Average fuel consumption is also pictured aside RPM values.


R27

News:
  • SOC drifting detection has been moved to additional analytics
  • RPM Distribution sheet added


Notable Temperatures

The HSD system has some temperature thresholds that the system uses for state transitions.
Full documentation is available on the Hybrid Synergy Forum.
Torque Log Analyzer displays time required to reach those thresholds beginning from the first start of the petrol engine.


For consistent results, logging should start at the beginning of the trip, with the engine off, and temperature should be set to Celsius degrees.

Sunday, February 22, 2015

Lexus CT 200h

With the help of user alexve of Hybrid Synergy Forum, Torque Log Analyzer has been successfully tested against a Lexus CT 200h


Monday, February 16, 2015

OBD adapters database

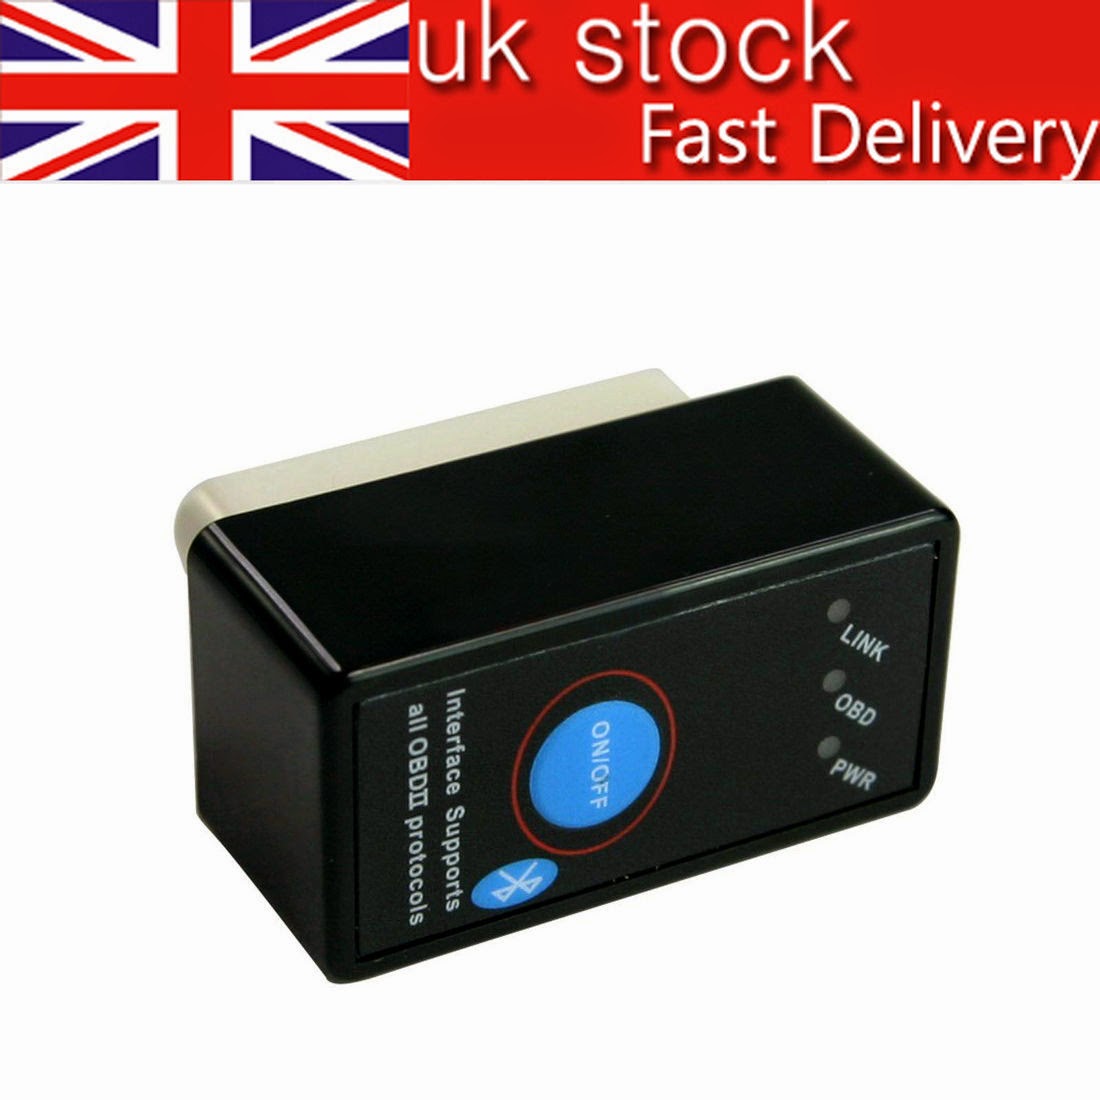
While testing Torque Log Analyzer with several different configurations, I've come across some different ODB adapters.
Here are some info about each one of them.
Since online vendors often change suppliers and links become outdated, I'm just posting photos of the adapters, so they can be searched online at the best price.


1)

No problems reported: collects as many as 45 PID/sec with no missing data.
ELM327 version: 1.5
Bluetooth pairing: needs pairing every new trip

2)
Duplicate rows on collected data, some PID reported as 0 from time to time.
ELM327 version: unknown
Bluetooth pairing: unknown

3)
No problems reported
ELM327 version: unknown
Bluetooth pairing: unknown

4)
Duplicate rows on collected data, some PID reported as 0 from time to time.
ELM327 version: unknown
Bluetooth pairing: unknown

5)

Disconnections reported
ELM327 version: 2.1
Bluetooth pairing: persistent

6)
80 PIDs/s
ELM327 version: 1.3a (STN1155 V3.4.1)
Bluetooth pairing: persistent

Sunday, February 8, 2015

R26

News:

  • user interface has been updated: to prevent scrolling, analytics and options lists are now collapsed at startup
    to open them, just click on the title


  • SOC drifting detection has been added
  • sheet size has been corrected for all chart sizes; now zoom on charts should be more usable