Sunday, March 22, 2015

Notable Temperatures

The HSD system has some temperature thresholds that the system uses for state transitions.
Full documentation is available on the Hybrid Synergy Forum.
Torque Log Analyzer displays time required to reach those thresholds beginning from the first start of the petrol engine.


For consistent results, logging should start at the beginning of the trip, with the engine off, and temperature should be set to Celsius degrees.

Sunday, February 22, 2015

Lexus CT 200h

With the help of user alexve of Hybrid Synergy Forum, Torque Log Analyzer has been successfully tested against a Lexus CT 200h


Monday, February 16, 2015

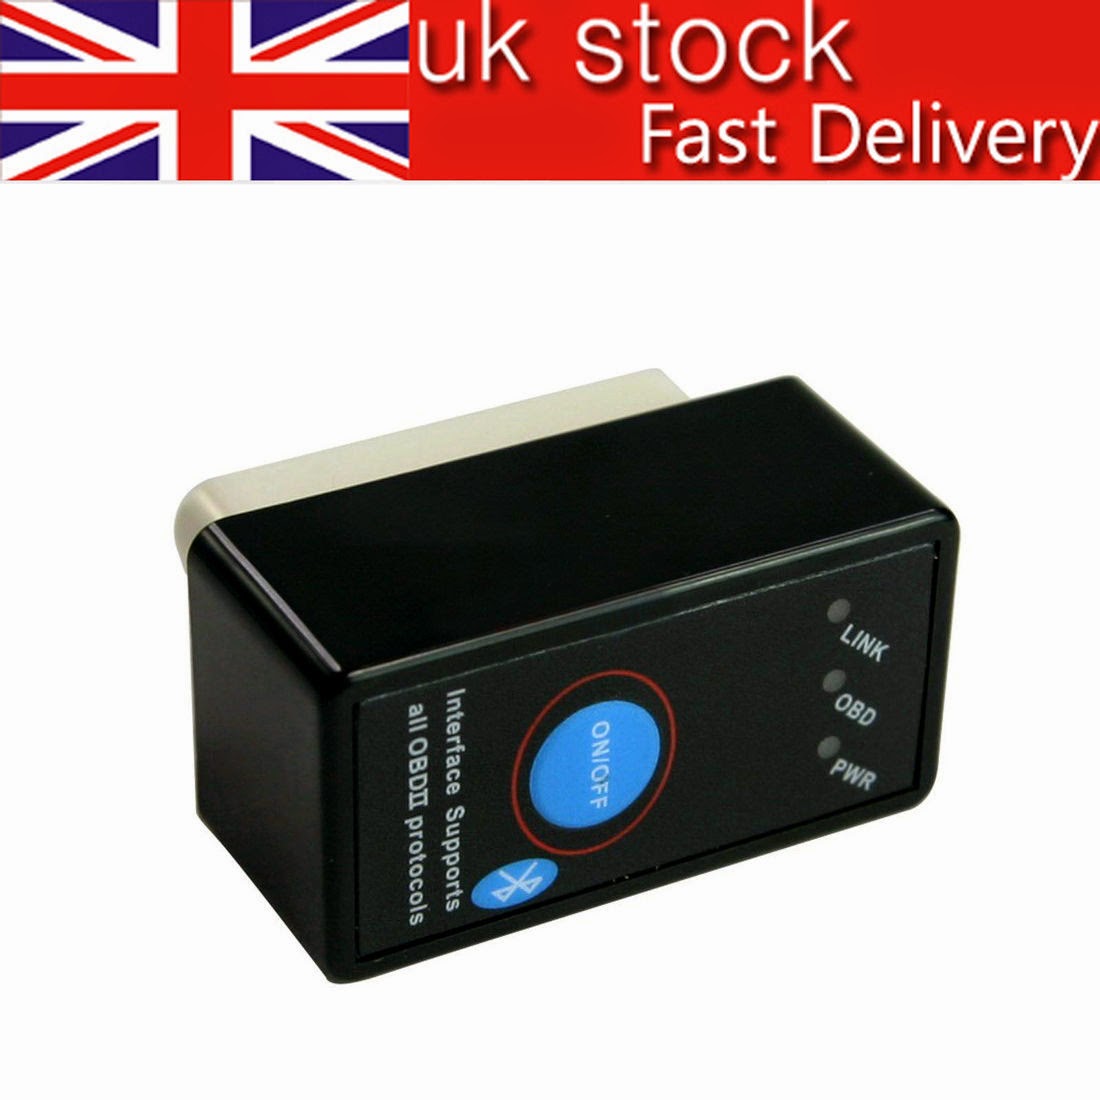
OBD adapters database

While testing Torque Log Analyzer with several different configurations, I've come across some different ODB adapters.
Here are some info about each one of them.
Since online vendors often change suppliers and links become outdated, I'm just posting photos of the adapters, so they can be searched online at the best price.


1)

No problems reported: collects as many as 45 PID/sec with no missing data.
ELM327 version: 1.5
Bluetooth pairing: needs pairing every new trip

2)
Duplicate rows on collected data, some PID reported as 0 from time to time.
ELM327 version: unknown
Bluetooth pairing: unknown

3)
No problems reported
ELM327 version: unknown
Bluetooth pairing: unknown

4)
Duplicate rows on collected data, some PID reported as 0 from time to time.
ELM327 version: unknown
Bluetooth pairing: unknown

5)

Disconnections reported
ELM327 version: 2.1
Bluetooth pairing: persistent

6)
80 PIDs/s
ELM327 version: 1.3a (STN1155 V3.4.1)
Bluetooth pairing: persistent

Sunday, February 8, 2015

R26

News:

  • user interface has been updated: to prevent scrolling, analytics and options lists are now collapsed at startup
    to open them, just click on the title


  • SOC drifting detection has been added
  • sheet size has been corrected for all chart sizes; now zoom on charts should be more usable


SOC Drifting

While searching for methods to evaluate HV Battery fitness, I've found this thread on the Hybrid Synergy Forum:

State of charge is primarily calculated using coulomb counting and is dynamically corrected using SOC drift points. 
Coulomb counting is a method that keeps track of current going into and out of the battery pack. Coulomb counting generally works quite well as long as the capacity of the battery is known and the current sensor is accurate enough. 
Because no coulomb counting system can be perfectly accurate, errors will eventually build up. 
To correct those errors, dynamic state-of-charge drift is used to compensate.

It seems that from time to time, SOC may vary by several % points with no significant currents applied.
Those variations may indicate a less-than-ideal battery condition.

Drifting detection has been added to Torque Log Analyzer: whenever such unexpected variations are detected, they'll be reported in the Analysis sheet.
If drifting is reported, a full HV Battery Fitness check is advised.

Sunday, January 18, 2015

R25

News:

  • Added option to zoom charts: use mouse wheel to zoom in/out, left click to pan, right click to reset.
    Warning: this feature is marked as "experimental" by Google, so it's disabled by default.


  • Google changed some options in scatter charts: maps are working again now.
  • Brakings code is now more permissive about "bad" brakings.

Thursday, January 15, 2015

A common mis-B-havior

It's a common belief that B is an efficient braking solution.
Many car salesmen say that to the customers during test drives, and it's frequently stated even on car reviews: B engages engine brake (true) and charges the battery more than conventional braking (false).
Let's check it:

Scenario: car running at 50 km/h
Test n. 1: switch to B and let the car slow down only by the effect of the engine brake.
Test n. 2: stick to D and press the brake pedal with enough pressure to mimic the same slow down of the B position.

The outcome is outlined in the chart below:


The first test starts at 17:56:20 and ends at 17:56:35
The second test starts at 17:56:52 and ends at 17:56:06
Current to the battery is the red line.
Negative values represent battery charging, generated by braking.
The red area is proportional to the current generated by the recharging effect.
The second area (the one generated by conventional braking) is greater than the first area (generated by engine brake in B).
The second area is 376 units wide vs 296 of the first, so by braking you gain 27% more energy than using B.


If we add fuel flow to the chart, we can see that using B we burn even some fuel.


By looking at the RPM chart, we notice that the petrol engine spins til 20 km/h