- delta thresholds in HV Battery Fitness sheet
Sunday, May 3, 2015

HV Battery error threshold
According to this article, Toyota sets a maximum acceptable delta between highest and lowest battery block at 1.2V
I suspect this difference alone is not enought to trigger the error.
I logged two different trips on a faulty Prius 3.
The first trip didn't trigger the error.
The second one did.
In the first trip, delta was above 1.2V for 5 seconds

In the second trip, delta was above 1.2V for 14 seconds, and the error was triggered

I suspect this difference alone is not enought to trigger the error.
I logged two different trips on a faulty Prius 3.
The first trip didn't trigger the error.
The second one did.
In the first trip, delta was above 1.2V for 5 seconds
In the second trip, delta was above 1.2V for 14 seconds, and the error was triggered
Wednesday, April 29, 2015
R29
News:
This release is focused on battery faults detection.
This release is focused on battery faults detection.
- Battery Temperature Chart (new PIDs required, see FAQ)
- Added Battery Block Delta Chart
- HV Fitness sheet extended with new measures
- Fixed error in Analysis sheet when RPM PID is missing
Battery Block Delta Chart
The Battery Block Delta chart shows maximum, average and minimum value of the battery blocks.
Note that blocks at maximum (or minimum) values at any given instant may not be always the same blocks.
Delta is shown on the right side scale: this is the difference between maximum and minimum values.
Worn out batteries have larger deltas.

Note that blocks at maximum (or minimum) values at any given instant may not be always the same blocks.
Delta is shown on the right side scale: this is the difference between maximum and minimum values.
Worn out batteries have larger deltas.
Battery Temperature Chart
The Battery Temperature Chart shows HV temperature over time.
Battery is split in 3 sections, each one having a termal sensor.
Tipically, the second section has the highest temperature, being surrounded by the other 2.
The chart also highlights 3 notable thresholds:

Battery is split in 3 sections, each one having a termal sensor.
Tipically, the second section has the highest temperature, being surrounded by the other 2.
The chart also highlights 3 notable thresholds:
- 35C: the HV fan starts spinning
- 42C: EV mode is not available any more due to high temperature
- 50C: the HV fan spins at maximum rate
Tuesday, April 28, 2015
How does a failed battery look like?
Here are 2 Prius of the same age, with comparable mileage:
The Battery Block Delta chart shows how all blocks values are close to each others:
Max Delta is 0.39
Average Delta is 0.10

Max Delta is 2.79
Average Delta is 0.34, three times as much as the other battery.

By comparison, let's look at a brand new Auris, that uses the same battery model as the Prius 3:
Average Delta is 0.10, just as the other good battery.

Here's an older car:
Average Delta is 0.15, a little worse than the brand new battery

- Prius 3, 2009, 140.000 km, good battery
The Battery Block Delta chart shows how all blocks values are close to each others:
Max Delta is 0.39
Average Delta is 0.10
- Prius 3, 2009, 183.000 km, failed battery
Max Delta is 2.79
Average Delta is 0.34, three times as much as the other battery.
- Auris, 2015, 1.000 km, good battery
Average Delta is 0.10, just as the other good battery.
Here's an older car:
- Prius 2, 2005, 270.000 km, good battery
Average Delta is 0.15, a little worse than the brand new battery
Sunday, April 26, 2015
Investigating a P0A80 Hybrid Battery Fault Code
On the Hybrid Synergy Forum, a user posted a thread about an Hybrid System error he had on his 189.000 km Prius 3.
We arranged to capture a Torque log to see if we could find the faulty element of the battery.
We drove to stress the battery a bit, by driving using EV traction alone, forcing charges by ICE and by brakings.
The car behaved erraticaly: the EV mode was refused even with a full battery and ICE won't stop, even standing still in P and with no HV charge in progress.
We suspected a temperature issue in the HV, so while parked we checked them up:
There was an unusually large difference between the 3 values, and while the fan was running apparently fine, TB3 was holding steady. Even with the car parked and no significant currents from the battery, temperature didn't decrease.
We powered off the car with a final SOC value of 54.1
When we powered it on again after a minute, SOC jumped instantly to 72.9.
We drove in EV trying to deplete the battery and then, suddenly, SOC went down from 62 to 24 in 15 seconds, causing ICE to start charging the battery.
That condition seems to have triggered the error, that showed up on the multifunction display:

The Current Flow chart shows the sudden SOC drop:


Clearly, Block 4 needs replacing.
We arranged to capture a Torque log to see if we could find the faulty element of the battery.
We drove to stress the battery a bit, by driving using EV traction alone, forcing charges by ICE and by brakings.
The car behaved erraticaly: the EV mode was refused even with a full battery and ICE won't stop, even standing still in P and with no HV charge in progress.
We suspected a temperature issue in the HV, so while parked we checked them up:
- TB1: 38.9C
- TB2: 43.55C
- TB3: 47.78C
There was an unusually large difference between the 3 values, and while the fan was running apparently fine, TB3 was holding steady. Even with the car parked and no significant currents from the battery, temperature didn't decrease.
We powered off the car with a final SOC value of 54.1
When we powered it on again after a minute, SOC jumped instantly to 72.9.
We drove in EV trying to deplete the battery and then, suddenly, SOC went down from 62 to 24 in 15 seconds, causing ICE to start charging the battery.
That condition seems to have triggered the error, that showed up on the multifunction display:
The Current Flow chart shows the sudden SOC drop:
The Battery Block chart gives an immediate evidence that something is working out of specs:
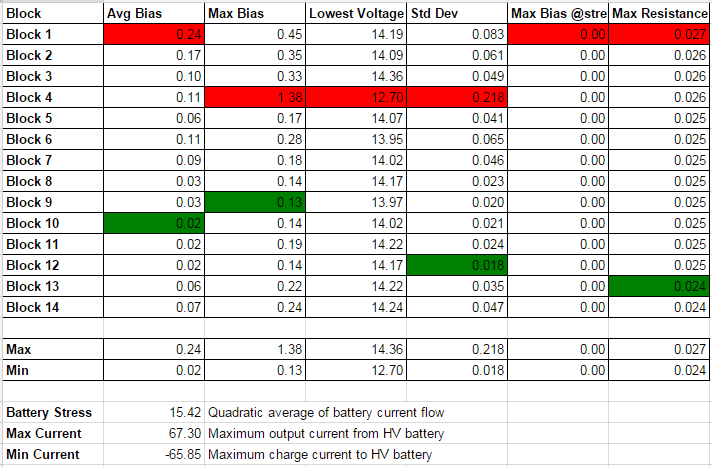
The HV Fitness sheet shows how Block 4 has the worst lowest voltage of all, the highest bias and standard deviation from battery average value.
Clearly, Block 4 needs replacing.
Subscribe to:
Posts (Atom)