Thursday, October 31, 2013

V14 released

As 13 is an unlucky number, here is version 14:

News:

  • SOC naming error corrected
  • Altitude naming error corrected
  • Added more grid lines in charts


  • ICE Off and EV % were off in the last version
  • Added EV to the Hybrid Map
  • Fix for missing time on charts
  • Car detection is more accurate
  • Added EV chart to use when GPS is missing.
  • Prius2 is now working again (need some work on Accelerator Pedal though)


The Rorschach test of engines

What do you see?

A mushroom?

A Sailboat?

These are RPM / Speed correlation charts of different transmissions.
The first one is an e-CVT from an Auris Hybrid, while the second is a traditional one from a Renault Megane.
The e-CVT can attain every speed with several different RPM from the engine, while a traditional transmission has to choose between a discrete and limited set.

Diesel / Hybrid highway comparison

Here is the same road (85% highway) driven with an Auris 2013 Hybrid and a Renault Megane 1.8D

Auris:

Megane:

It's a somewhat uneven comparison, as the Megane held an higher speed, but it's interesting to note that the Auris mileage curve is still climbing after nearly 100 km.
Megane mileage curve instead has peaked and is going down.
The peak is related to a stop at a service station.
But why it suffers from that?
Maybe the sudden stop drops temperature?
Let's add coolant temperature to the same graph:
Auris:

Megane:

That doesn't seem to be the case: there's a drop in temperature, but it affects the Auris, not the Megane.
By the way we can observe that the diesel engine has a lower operating temperature than the HSD and the Auris reaches working temperature after nearly 20 km.

Wednesday, October 30, 2013

V13 released

News:

  • SOC gained while coasting


  • ICE off evaluation is now more accurate (engine spinning with no fuel is included)


Saturday, October 26, 2013

V12 released

News:

  • Prius 3 braking evaluation is now correct

Fuel flows

Fuel consumption of the 2 newer HSD engines, measured in fuel cc/minute at various engine RPMs.

Yaris, 1500 cc:

Auris, 1800cc:
Note that at 1000 RPM consumption seems to be just the same, but as the RPMs increases, Auris has a steeper curve.

Prius 3 MY 2012 brake analysis

Here is brake from a MY 2012 Prius 3, Regen Coop in yellow:

There are some differences from Yaris:

  • base value of WCyl is 0.47058824 instead of 0.49019608
  • WCyl seems to always increase when braking: on Yaris it doesn't seem to increase when only regenerative braking is in use.
  • the value of WCyl when regeneration is active is 0.49019608, just the same as the base value of Yaris...
  • regenerative braking turns of under 18km/h (I suspect the cut-off value is 12 as in other HSD cars).


Friday, October 25, 2013

V11 released

News:

  • map aspect ratio should be correct now
  • added RPM /fuel flow chart
  • missing GPS data won't corrupt maps anymore


Thursday, October 24, 2013

Diesel / Hybrid showdown on a short trip

It's a common belief that hybrids are disadvantaged on short trips because of the S1 phase that's necessary to bring the engine up to operating temperature.

Here is a comparison of the same short trip as driven by an Auris Hybrid 1.8 2013 and a Renault Megane III 1.8D SW

Here is the Auris, scoring at 16.3 km/l

and here is the Megane at 8.54 km/l
The hybrid builds up slower, but as soon as you cross 1 km distance, it gains the lead, and still climbing. We know that full potential comes up after several kilometers and is in the range of 30 km/l

Wednesday, October 23, 2013

1000

This site has reached 1000 page views today, exactly one month after going live.
Thank you all.

Sunday, October 20, 2013

V10 released

New version available:

  • Missing PIDs are now reported more clearly in the log sheet
  • SOC regeneration (SOC % gain due to regenerative braking)


  • Mileage chart (cumulative Km/l over distance)


  • EV Excess chart (where was it better to use ICE instead of EV?)


Saturday, October 19, 2013

Speed and braking

SOC % gained while braking at a given speed:

SOC gain increment seems to be largely independent of speed.
Or better: higher speeds leads to longer brakings, and thus longer recharge.
But every single second of recharge has always the same value: a little less than 0.4%.


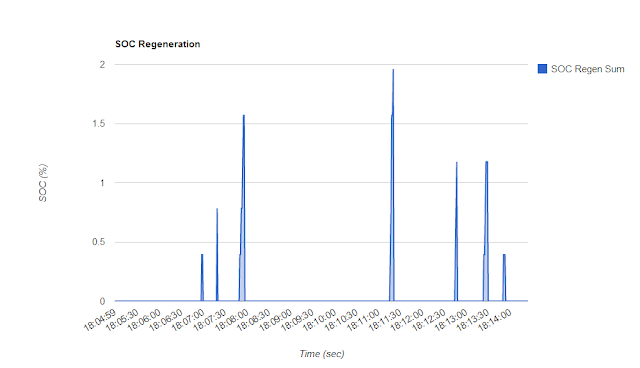
SOC Regeneration while braking

Here is the chart of SOC regeneration during braking.


SOC tipically grows in 0.3% steps every second.
My best gain in this trip is nearly 2% over 6 seconds.

Thursday, October 17, 2013

V9 released

New features:

  • removed limit of 40.000 cells (about 1 hour of logging)
  • added engine torque chart
  • brake evaluation rewritten for more accuracy
  • SOC gained by regenerative braking


Tuesday, October 15, 2013

Tuesday, October 8, 2013

V8 released

News:

  • now all maps are merged into one for better visualization of the trip
  • accelerator usage statistics


Wednesday, October 2, 2013

RPM and Speed

Here is the same road, driven in 3 different modes:
  • Normal: just plain well-behaved hybrid driving.
  • EV: trying to use as much EV as possible
  • Speedy: aggressive driving
We can see that every style has its own peculiar signature:


Compared to Normal, EV has higher RPM values: that means that while the petrol engine may be used less, it will spin faster to recharge the battery.


Comparing different driving styles

Torque Log Analyzer is well suited for comparing different trips on the same road.
Here is an example.
My commute back from work is usually regular and I know the road really well, so I experimented with 2 different styles:
relaxed driving, with as little changes of pace as possible.
aggressive driving, with braking to the limit and overtaking every other car.

Two report parameters may measure driving style:
  • Average Absolute Speed Variation
  • Battery Stress

For the relaxed driving, Speed Variation is 1.97, while on aggressive, it scores 3.11.
So a lower value means a more relaxed driving.
Battery Stress measures current flow in and out of the HV battery: just like an elastic rope, the lesser the stretch, the longer the life expectancy.
Relaxed driving scores 21.58, while aggressive amounts to 35.93.
So an aggressive driving results in more battery consumption.

V7 Released

New features:
Maps with notable events (glide, brake, ignitions)
Prius 2 is now supported with its peculiar PIDs. (Thanks to justin12 of priusfreunde.de)


Tuesday, October 1, 2013

Prius 2 Braking Analysis

Courtesy of justin12 of priusfreunde.de I've got hold of Prius 2 log file with a couple of brakings.


I've identified 2 PIDs that may come handy for brake evaluation
Brake - Regenerative Torque (lbs-ft)(lb-ft)
Brake - Friction Pad Torque (lbs-ft)(lb-ft)

Names are sufficiently explanatory of the 2 braking systems.
Hydraulic braking seems to kick in at 12 Km/h as in the other HSD cars so far.

Differently from Yaris Hybrid, the braking system of the Prius 2 seems to always use some friction pad: look at the beginning of the first braking: there's a small bump in the yellow line, and even when the regenerative system is fully working, the friction value is not 0.
Peak Friction Pad peak value during a regenerative braking is -590080023 while a full effect braking starts at -4425600052.
In the second braking there is an even greater concurrency between the two braking systems.