Sunday, March 30, 2014

The SOC KM equation

Is this the Holy Grail of Hybrid?

It's one of the most recurring questions: how many km can you drive with a single battery bar?
No one knows this equation, but if theory is too hard, we can try to solve it by trial and error.
Let's pick all the EV sequences out of a trip.
For each sequence, calculate the difference between ending SOC and starting SOC.
Dividing that difference by the distance in the same sequence, we'll find how many km have been done with each percentage point of SOC.
Iterate for all sequences and get the average value.
This values seems to be related to road and driving style.
Different car models should have different values too.

Here are some results on my common trips:
highway: 3.249163337
hill road: 2.466879256
urban: 8.811943764

Please note that the numbers above represents how many SOC % points are needed to drive 1 km in EV in the specified road types.
Some explainations:
in a urban environment, you need 8% SOC to drive 1 km, while driving up and down hill a little more than 2 will suffice.
One of the reasons is that city driving is usually full of starts, stops and changes of pace, while country roads lead to higher and constant speed.

There's a thread about this on the Hybrid Synergy Forum here: http://www.hybrid-synergy.eu/showthread.php?tid=47601

Thursday, March 27, 2014

V47


  • corrected error in rpm load chart
  • corrected error in rpm heretical chart
  • added menu item "Analyze all" for those who have sidebar issues
  • corrected error in EV range estimate
  • error in map size fixed by google
  • added SOC/Km evaluation
  • rewritten load chart with highlight of different states (thanks to alesf76 of the Hybrid Synergy Forum)


Sunday, March 23, 2014

V46

News:

  • Explorer mode on charts (mouse wheel to zoom, drag to pan)
  • RPM / Engine Load chart


Comparison of Engine Load on Hybrid and Diesel engines

According to this definition, Engine Load somewhat indicates engine efficiency at a given RPM.

Here are two chart of the same trip, first with a Yaris Hybrid, and then with a CMax Diesel


The Hybrid engine has a steady higher efficiency.

V45

News:


  • Fuel flow / Engine Load


Saturday, March 22, 2014

Yaris Sweet Spot

This seems to be a sweet spot:

Environmental conditions:
straight extraurban road
indicated speed around 70 km/h
HSI indicator on the exact half of the ECO zone


After an acceleration phase, with RPM over 1500, revs settle down a little over 1000.
SOC is slightly growing, speed is constant in the ending.
The road is slightly downhill, but only 5 meters over 1 km.

Let's substitute elevation with accelerator pedal position:


After the initial pressure, pedal was settled down on a steady position.

Maybe it's the electric motor that is helping the petrol engine keeping its revs down?
Let's see the electric aid chart:


Current is flowing only in the initial acceleration phase, not during the following run.

Here's the engine load:


It doesn't change significantly over the sweet spot.
We can also see that the sweet spot happens during the heretical car state.

Let's add fuel flow to the chart:


The flow has values comparable to the S1 phase.

Starting up

Fast and furious or slow and steady?

Scenario: urban road, no one ahead or behind. Starting from standing still and accelerating to the maximum admitted speed of 50 km/h.

Method n.1: start using the electric engine up to 20 km/h and then forcing ICE with HSI just above the upper half of the ECO area.

Method n.2: immediate ICE usage, by pushing HSI over ECO.

Test n.1:

You can clearly see the electric peak at 5 sec, where ICE turns on.

Test n.2:
Here, electric contribution is nearly absent, given the immediate ICE usage.

Observations:

- Time:
To achieve the same speed, the electric start needs 20 seconds versus 14 of the engine start.
Note that in both cases, we're talking about a relaxed start, not a sporting one.
Both starts are anyway enough to dab a preceding car starting at the same time at our same traffic light.

- Fuel:
1: 0.01909781 litres
2: 0.01972395 litres
immediate ignition burns more fuel

- SOC:
1: SOC goes down about 1%, but by the time we reach target speed, SOC value has recovered what we lost
2: Even in this test, SOC maintains its starting value.

While interesting, values involved in this test are of little magnitude, so nothing conclusive can be inferred.


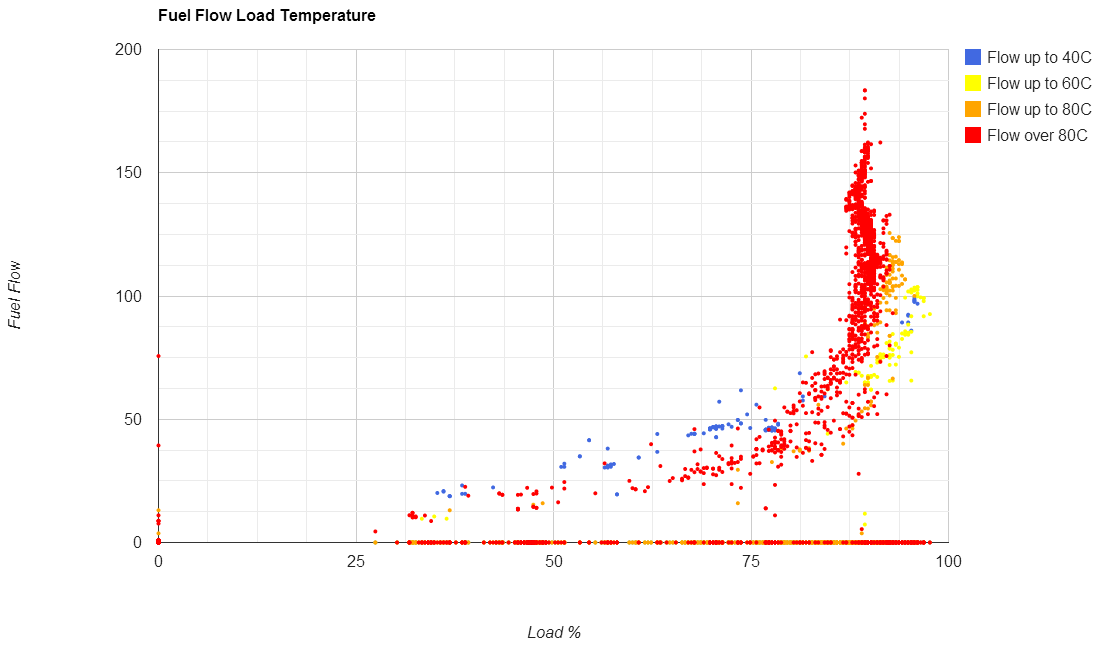
Fuel Flow by Temperature

The Fuel Flow Temperature chart shows fuel usage at different engine temperatures.
Colors are hotter as the engine gets hot.
At 2000 RPM you can see that the fuel flow at higher temperature (displayed in red) is lower than the colder orange one.

V44

News:

  • Fuel flow by temperature chart


Friday, March 21, 2014

V43

News:

  • sweet spot chart
  • fixed missing authorization error


What do you do with a car that has only 2 Km of electric range?

How many time have you been asked this question?
How many hybrid reviews end that way?

Now you can answer with Torque Log Analyzer: the new version reports how many km you have run in EV along your trip.

Here are some of my common trips:

  • 13.23 km urban/extra, 3.03 in EV
  • 8.78 km urban/extra, 3.63 in EV
  • 71.11 km highway, 6.36 in EV
  • 45.36 km urban/extra/hills, 18.82 in EV

So, what do you do with a car that has only 2 km of electric range?
I run for 18!

There's a thread about this on the Hybrid Synergy Forum

Thursday, March 20, 2014

New Icon

Torque Log Analyzer finally has an icon:

V42

News:


New UI

Torque Log Analyzer has a brand new user interface:
Import log files as usual, select analytics and then click "Analyze".


If the sidebar doesn't appear, select "Start" from the "Add-ons" menu.


Sunday, March 16, 2014

Diesel/Hybrid comparison

Here is the same trip:
Yaris Hybrid:

Ford CMax 2010 1.6 TD:

Fuel Flow at engine start

The Flow at Start chart picks every ICE ignition and calculate the fuel flow average over 3 seconds.
The resulting value is plotted against car speed.


V41

News:

  • RPM average is now calculated only while ICE is running
  • New chart of Fuel Flow at engine start


Friday, March 14, 2014

V40

News:
  • this version runs on the new Google Sheets
  • more speed when importing data
  • more speed when scrolling data sheet
  • more speed when browsing graphs
  • no more cell limits (try your biggest log)
  • horizontal axis is now "Distance" on most charts


Thursday, March 13, 2014

Issue with Maps

There is currently an issue on the map size: if you see a really small map, click on the image, select the down arrow and the "Reset size".
The map will be reset to its correct dimensions.


It seems to be a bug of the newer Google Sheets:

https://code.google.com/p/google-apps-script-issues/issues/detail?id=3770

Wednesday, March 12, 2014

V39

News:

  • better regeneration evaluation
  • better coasting detection
  • added charts of current recovery while coasting and braking


Current generation while coasting

Gathering data from an highway trip full of ups and downs, here's the chart of the current generated when the car is coasting (running without pressing the accelerator or the brake pedal).


Observations:
Beside some spurious samples in the transition phases, a clear behavior emerges.
Under 12 km/h there's no energy recovery, instead crawling consumes some energy also.
The energy recovered grows along speed until a little less than 60 km/h, afterwards it decrease a little and then it's steady until 100 km/h where it decreases again.

I suspect that every car model has its own characteristic curve.

Tuesday, March 11, 2014

Steep ramps and gently slopes

Better steep or gently?

To answer, we'd need 2 roads that start and finish in the same place, while passing the same peak.
Pretty hard to find.
We may try to find an approximate answer with an asymmetric trip: the outward leg has a gentler slope than the return one.
The altimetric profile shows an highway section, so we are talking about higher than usual speed here.


We can't use the full trip, because the starting and ending point are at different altitude.
We need to fix a fictional "zero level" from which we'll start from one side of the mountain and end on the other side.
By picking up 2 point of equal altitude, we'll have equal potential energy; we also need to account for differences of cinetic energy (we're not standing still in those points) and electric energy (SOC level).
Let's choose the 150 m quote that crosses the profile first after 6 km and then again on the downward slope at nearly 63 km.
Using GPS coordinates, we can find the same point on the return trip log.

Here's the start:
Row: 612
Longitudine: 8.57436894
Latitudine: 44.87122654
Speed: 84
SOC: 56.47058868

And the finish line:
Row: 2066
Longitudine: 8.73766059
Latitudine: 44.4367162
Speed: 98
SOC: 69.41176605

We need to delete from the log all rows not belonging to the above range.
Then, we should rewrite columns
Trip Distance(km)
Fuel used (trip)(l)
by subtracting the value of the starting point to all other values.

Now, by running the analyzer, we'll have the stats only for the selected range.

Moving on to the return trip log, we search for the same points used as start and finish, this time in reverse order tough.

Start
Row: 1009
Speed: 68
SOC: 63.52941132

Finish
Row: 2502
Speed: 81
SOC: 60.7843132

Another analyzer run will gather the stats for this trip also.

Let's focus immediately on the main parameter:

Gently slope:
Fuel used3.01litres, as reported by Torque


Steep slope:
Fuel used3.12litres, as reported by Torque


Driving the gently slope, we save 0.11 liters.
Do boundary conditions justify this difference?

On the gently slope we finish with 12% more SOC, another energy credit.
On the steep slope we finish with 2% less SOC, so we lost energy.

On the gently slope we finish with 14km/h more.
On the steep slope we finish with 13km/h more.
It seems the same, but cinetic energy is related to the speed squared and the greater exit speed is the one of the gently slope (98 vs 81).

So, consumption in the case of the gently slope is potentially even lower, because we spare some energy to use on the road ahead.

Let's see some other interesting parameter:
Battery Stress8.37Quadratic average of battery current flow
vs
Battery Stress7.82Quadratic average of battery current flow
The steep slope puts less stress on the battery, mainly because we recover less SOC.

HSI:
HSI PWR %0.00Hybrid System Indicator % time in Power zone
HSI Upper ECO %89.75Hybrid System Indicator % time in the upper half of ECO zone
HSI Lower ECO %3.39Hybrid System Indicator % time in the lower half of ECO zone
HSI CHG %6.86Hybrid System Indicator % time in Charge zone
vs
HSI PWR %4.42Hybrid System Indicator % time in Power zone
HSI Upper ECO %91.10Hybrid System Indicator % time in the upper half of ECO zone
HSI Lower ECO %1.74Hybrid System Indicator % time in the lower half of ECO zone
HSI CHG %2.74Hybrid System Indicator % time in Charge zone
on the steep road we have to venture in the PWR zone and spend less time in CHG.

Engine load:
Average Engine Load83.68Mean value considering only non-zero values
Min Engine Load30.20Excluding zero values
Max Engine Load92.94Maximum value
vs
Average Engine Load86.38Mean value considering only non-zero values
Min Engine Load33.73Excluding zero values
Max Engine Load92.16Maximum value
no significant differences exists.

Sunday, March 9, 2014

V38

News:

  • correct step in map markers
  • max and average RPM
  • min and max current
  • altimetric chart
  • consistent colors across charts


Sunday, March 2, 2014

V37

News:

  • added check for max file size in "Import CSV": big files should be imported the old way
  • added Google Map (check the FAQ)