Google is rolling out the new version of its spreadsheet application.
Features are interesting:
http://googleblog.blogspot.it/2013/12/new-google-sheets-faster-more-powerful.html
But hold on a little more, cause there is an issue with Torque Log Analyzer that prevent it to run correctly:
https://code.google.com/p/google-apps-script-issues/issues/detail?id=3573
For the time being, make sure your Log Analyzer sheets are still at the old version.
Tuesday, February 25, 2014

Sunday, February 23, 2014
V34 available
News:
- Pulse, Glide and Neutral % are more accurate now
- Heretical mode is now computed in the stats (new PID needed: "MG1 revolutions")
- New chart for ICE RPM and speed in Heretical mode
Thursday, February 20, 2014
Crop Circles
Sometimes strange patters emerge from charts: here is a long highway trip.
What's that strip with no points?

What's that strip with no points?
Wednesday, February 19, 2014
Fuel flow at different engine temperatures
Here is the fuel flow in cc/min at different engine temperature:
Ice blue for temperature less than 40C
Blue for temperature between 40 an 60
Orange for temperature between 60 an 80
Red for temperature over 80

There seems to be an emergent behavior of lower consumption at higher temperatures.
Ice blue for temperature less than 40C
Blue for temperature between 40 an 60
Orange for temperature between 60 an 80
Red for temperature over 80
There seems to be an emergent behavior of lower consumption at higher temperatures.
Saturday, February 15, 2014
V33 available
News:
- paraglide is displayed only if HSI is not available
- mileage pids are required to contain km and l
- engine load stats and chart
The 65% step
I've seen several Electric Aid charts by now, and they all seems to have this step at 65% SOC.
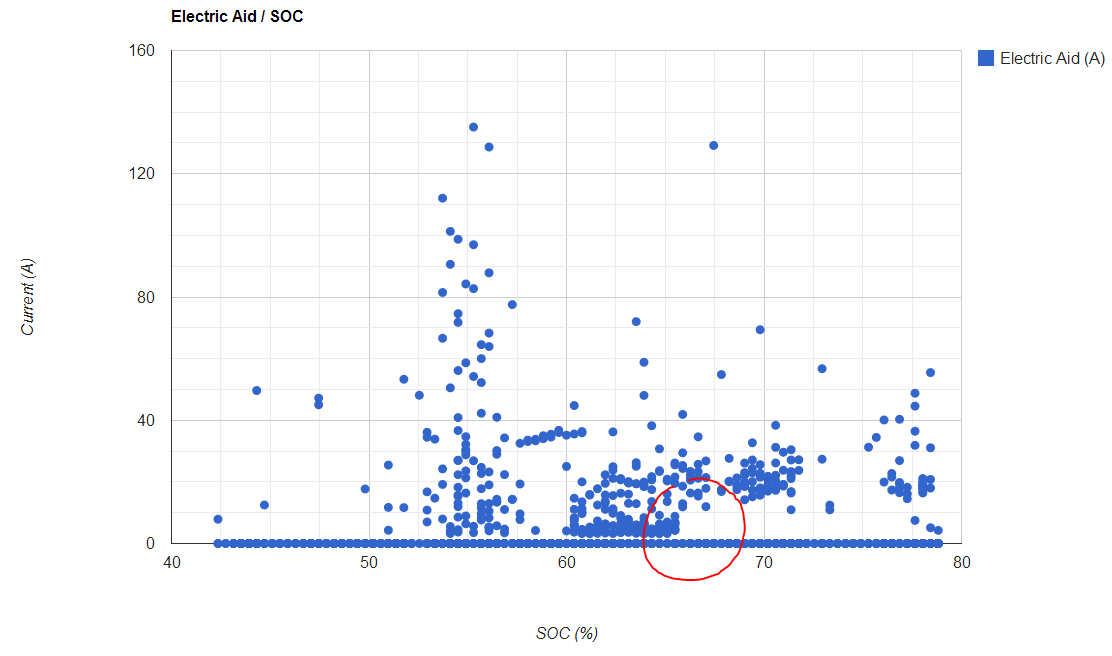
This chart shows amperes flowing out of the HV battery while the petrol engine is running and gives an estimate of the electric contribution to the car movement.
It seems that after 65% the HV battery supply a minimum of 10A to the engine, while under 65% lower flows are permitted.
Here's the same trip with a different perspective: engine RPMs are charted only when there's an electric contibution to the petrol engine.

Higher SOC values seem to lead to lower RPMs.
This chart shows amperes flowing out of the HV battery while the petrol engine is running and gives an estimate of the electric contribution to the car movement.
It seems that after 65% the HV battery supply a minimum of 10A to the engine, while under 65% lower flows are permitted.
Here's the same trip with a different perspective: engine RPMs are charted only when there's an electric contibution to the petrol engine.
Higher SOC values seem to lead to lower RPMs.
Wednesday, February 5, 2014
To B or not to B
Yaris seems to be different from previous generation Prius
Using the B gear leads to higher RPMs
Here's chart of near constant speed travelling with a transition from D to B on a plain road.
 More evidence of higher RPMs in B with a chart of a start from 0 to 70.
 Same test using D

There seems to be more electric aid in B than in D

 Now, with Torque x RPM


Using the B gear leads to higher RPMs
Here's chart of near constant speed travelling with a transition from D to B on a plain road.
There seems to be more electric aid in B than in D
Subscribe to:
Posts (Atom)